How I Built This
What impacts the amount of people in the stadium?
My model looks at five measurable variables from games taking place between 2000 and 2024.
- Stadium Capacity
- Fill Rate (% of the stadium filled)
- Team Record (wins & losses)
- Precipitation Amount (Rain/Snow values between 0–1, like 0.10 for light rain)
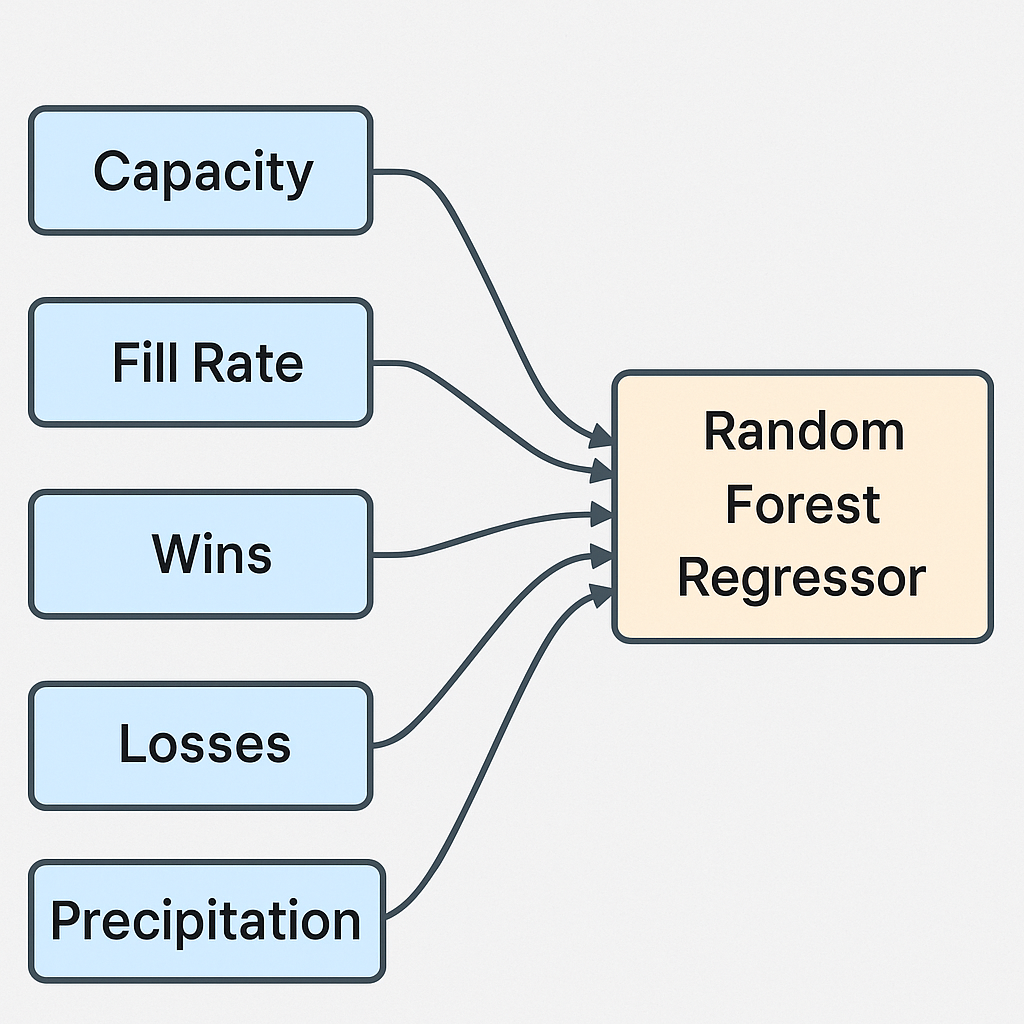
Why Random Forest Regression?
Random Forest regression is a machine learning method that combines many individual decision trees. Each tree makes its own prediction, and the forest averages them together. This approach reduces bias and avoids overfitting, meaning the model can better handle complex patterns in college football attendance. I used it because attendance depends on many interacting factors, and Random Forests can capture these relationships while staying accurate and reliable.

Limitations
This model is not updated instantly throughout the season, so it cannot always capture sudden shifts in fan behavior. Every year brings anomalies, programs rise and fall in popularity, creating attendance swings that historical data alone won’t predict.
For example, Indiana’s average fill rate was around 0.76, but recent seasons have pushed it closer to 0.90, reflecting a surge in demand. Models trained on older data may underestimate this type of change. Because of this, predictions should be seen as guidance, not guarantees. To improve my model, I plan to add ticket sales and live price tracking as inputs in the future, creating gametime estimates that adapt to real-world demand.